-
Pl
chevron_right
Erlang Solutions: MongooseIM 6.3: Prometheus, CockroachDB and more
news.movim.eu / PlanetJabber • 14 November 2024 • 9 minutes
MongooseIM is a scalable, efficient, high-performance instant messaging server using the proven, open, and extensible XMPP protocol. With each new version, we introduce new features and improvements. For example, version 6.2.0 introduced our new CETS in-memory storage, making setup and autoscaling in cloud environments easier than before (see the blog post for details). The latest release 6.3.0 is no exception. The main highlight is the complete instrumentation rework, allowing seamless integration with modern monitoring solutions like Prometheus.
Additionally, we have added CockroachDB to the list of supported databases, so you can now let this highly scalable database grow with your applications while avoiding being locked into your cloud provider.
Observability and instrumentation
In software engineering, observability is the ability to gather data from a running system to figure out what is going inside: is it working as expected? Does it have any issues? How much load is it handling, and could it do more? There are many ways to improve the observability of a system, and one of the most important is instrumentation . Just like adding extra measuring equipment to a physical system, this means adding additional code to the software. It allows the system administrator to observe the internal state of the system. This comes with a price. There is more work for the developers, increased complexity, and potential performance degradation caused by the collection and processing of additional data.
However, the benefits usually outweigh the costs, and the ability to inspect the system is often a critical requirement. It is also worth noting that the metrics and events gathered by instrumentation can be used for further automation, e.g. for autoscaling or sending alarms to the administrator.
Instrumentation in MongooseIM
Even before our latest release of MongooseIM, there have been multiple means to observe its behaviour:
Metrics provide numerical values of measured system properties. The values change over time, and the metric can present current value, sum from a sliding window, or a statistic (histogram) of values from a given time period. Prior to version 6.3, MongooseIM used to store such metrics with the help of the exometer library. To view the metrics, one had to configure an Exometer exporter, which would periodically send the metrics to an external service using the Graphite protocol. Because of the protocol, the metrics would be exported to Graphite or InfluxDB version 1 . One could also query a limited subset of metrics using our GraphQL API (or the legacy REST API) or with the command line interface. Alternatively, metrics could be retrieved from the Erlang shell of a running MongooseIM node.
Logs are another type of instrumentation present in the code. They inform about events occurring in the system and since version 4, they are events with extensible map-like structure and can be formatted e.g. as plain text or JSON. Subsequently, they can be shown in the console or stored in files. You can also set up a log management system like the Elastic (ELK) Stack or Splunk – see the documentation for more details.
The diagram below shows how these two types of instrumentation can work together:
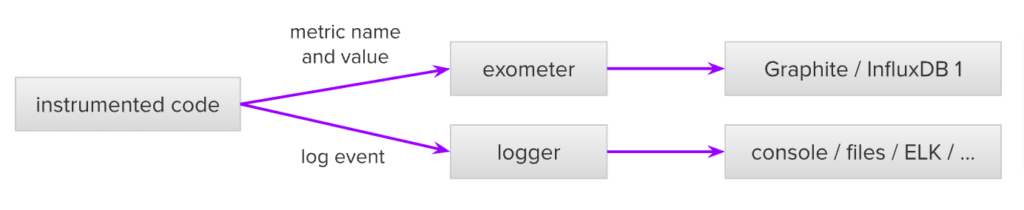
The first observation is that the instrumented code needs to separately call the log and metric API. Updating a metric and logging an event requires two distinct function calls. Moreover, if there are multiple metrics (e.g. execution time and total number of calls), there would be multiple function calls required. There is potential for inconsistency between metrics, or between metrics and logs, because an error could happen between the function calls. The main issue of this solution is however the hardcoding of Exometer as the metric library and the limitation of the Graphite protocol used to push the metrics to external services.
Instrumentation rework in MongooseIM 6.3
The lack of support for the modern and widespread Prometheus protocol was one of the main reasons for the complete rework of instrumentation in version 6.3. Let’s see the updated diagram of MongooseIM instrumentation:
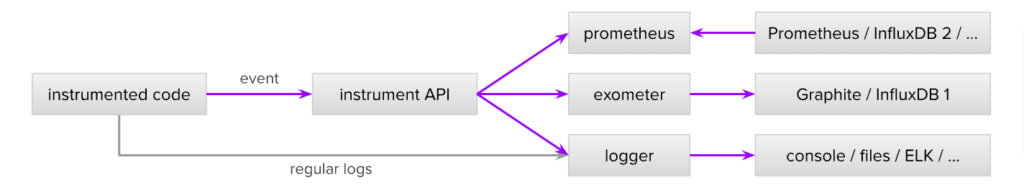
The most noticeable difference is that in the instrumented code, there is just one event emitted. Such an event is identified by its name and a key-value map of labels and contains measurements (with optional metadata) organised in a key-value map. Each event has to be registered before its instances are emitted with particular measurements. The point of this preliminary step is not only to ensure that all events are handled but also to provide additional information about the event, e.g. the measurement keys that will be used to update metrics. Emitted events are then handled by configurable handlers . Currently, there are three such handlers. Exometer and Logger work similarly as before, but there is a new Prometheus handler as well, which stores the metrics internally in a format compatible with Prometheus and exposes them over an HTTP API. This means that any external service can now scrape the metrics using the Prometheus protocol. The primary case would be to use Prometheus for metrics collection, and a graphical tool like Grafana for display. If you however prefer InfluxDB version 2, you can easily configure a scraper , which would periodically put new data into InfluxDB.
As you can see in the diagram, logs can be also emitted directly, bypassing the instrumentation API. This is the case for multiple logs in the system, because often there is no need for any metrics, and a log message is enough. In the future though, we might decide to fully replace logs with instrumentation events, because they are more extensible.
Apart from supporting the Prometheus protocol, additional benefits of the new solution include easier configuration, extensibility, and the ability to add more handlers in the future. You can also have multiple handlers enabled simultaneously, allowing you to gradually change your metric backend from Exometer to Prometheus. Conversely, you can also disable all instrumentation, which was not possible prior to version 6.3. Although it might make little sense at first glance, because it can render the system a black box, it can be useful to gain extra performance in some cases, e.g. if the external metrics like CPU usage are enough, in case of an isolated embedded system, or if resources are very limited.
The table below compares the legacy metrics solution with the new instrumentation framework:
| Solution | Legacy: mongoose_metrics | New: mongoose_instrument |
| Intended use | Metrics | Metrics, logs, distributed tracing, alarms, … |
| Coupling with handlers | Tight: hardcoded Exometer logic, one metric update per function call | Loose: events separated from configurable handlers |
| Supported handlers | Exometer is hardcoded | Exometer, Prometheus, Log |
| Events identified by | Exometer metric name (a list) | Event name, Labels (key-value map) |
| Event value | Single-dimensional numerical value | Multi-dimensional measurements with metadata |
| Consistency checks | None – it is up to the implementer to verify that the correct metric is created and updated | Prometheus HTTP endpoint, legacy GraphQL / CLI / REST for Exometer |
| API | GraphQL / CLI and REST | Prometheus HTTP endpoint,legacy GraphQL / CLI / REST for Exometer |
There are about 140 events in total, and some of them have multiple dimensions. You can find an overview in the
documentation
. In terms of dashboards for tools like Grafana, we believe that each use case of MongooseIM deserves its own. If you are interested in getting one tailored to your needs, don’t hesitate to
contact us
.
Using the instrumentation
Let’s see the new instrumentation in action now. Starting with configuration, let’s examine the new additions to the default configuration file :
[[listen.http]]
  port = 9090
  transport.num_acceptors = 10

  [[listen.http.handlers.mongoose_prometheus_handler]]
    host = "_"
    path = "/metrics"

(...)

[instrumentation.prometheus]

[instrumentation.log]
The first section,
[[listen.http]]
, specifies the Prometheus HTTP endpoint. The following
[instrumentation.*]
sections enable the Prometheus and Log handlers with the default settings – in general, instrumentation events are logged on the
DEBUG
level, but you can change it. This configuration is all you need to see the metrics at
http://localhost:9091/metrics
when you start MongooseIM.
As a second example, let’s say that you want only the Graphite protocol integration. In this case, you might configure MongooseIM to use only the Exometer handler, which would push the metrics prefixed with
mim
to the
influxdb1
host every 60 seconds:
[[instrumentation.exometer.report.graphite]]
  interval = 60_000
  prefix = "mim"
  host = "influxdb1"
There are more options possible, and you can find them in the
documentation
.
Tracing – ad-hoc instrumentation
There is one more type of observability available in Erlang systems, which is tracing . It enables a user to have a more in-depth look into the Erlang processes, including the functions being called and the internal messages being exchanged. It is meant to be used by Erlang developers, and should not be used in production environments because of the impact it can have on a running system. It is good to know, however, because it could be helpful to diagnose unusual issues. To make tracing more user-friendly, MongooseIM now includes erlang_doctor with some MongooseIM-specific utilities (see the tr_util module). This tool provides low-level ad-hoc instrumentation, allowing you to instrument functions in a running system, and gather the resulting data in an in-memory table, which can be then queried, processed, and – if needed – exported to a file. Think of it as a backup solution, which could help you diagnose hidden issues, should you ever experience one.
CockroachDB – a database that scales with MongooseIM
MongooseIM works best when paired with a relational database like PostgreSQL or MySQL, enabling easy cluster node discovery with
CETS
and persistent storage for users’ accounts, archived messages and other kinds of data. Although such databases are not horizontally scalable out of the box, you can use managed solutions like
Amazon Aurora
,
AlloyDB
or
Azure Cosmos DB for PostgreSQL
. The downsides are the possible vendor lock-in and the fact that you cannot host and manage the DB yourself. With version 6.3 however, the possibilities are extended to
CockroachDB
. This PostgreSQL-compatible distributed database can be used either as a provider-independent cloud-based solution or as an internally hosted cluster. You can instantly set it up in your local environment and take advantage of the horizontal scalability of both MongooseIM and CockroachDB. If you want to learn how to deploy both MongooseIM and CockroachDB in Kubernetes, see the
documentation
for CockroachDB and the
Helm chart
for MongooseIM, together with our recent
blog post
about setting up an auto-scalable cluster. If you are interested in having an auto-scalable solution deployed for you, please consider our
MongooseIM Autoscaler
.
Summary
MongooseIM 6.3.0 opens new possibilities for observability – the Prometheus protocol is supported instantly with a new reworked instrumentation layer underneath, guaranteeing ease of future extensions. Regarding database integration, you can now use CockroachDB to store all your persistent data. Apart from these changes, the latest version introduces a multitude of improvements and updates – see the release notes for more information. As the next step, we recommend visiting our product page to see the possible options of support and the services we offer. You can also try the server out at trymongoose.im . In any case, should you have any further questions, feel free to contact us .
The post MongooseIM 6.3: Prometheus, CockroachDB and more appeared first on Erlang Solutions .